Empirical project 11 Solutions
These are not model answers. They are provided to help students, including those doing the project outside a formal class, to check their progress while working through the questions using the Excel, R, or Google Sheets walk-throughs. There are also brief notes for the more interpretive questions. Students taking courses using Doing Economics should follow the guidance of their instructors.
Part 11.1 Summarizing the data
-
Surveys rely on respondents’ subjective opinions, which are subject to biases. These biases may affect the two types of answers differently. Public awareness of climate change issues has increased significantly over the past few decades, and people may feel morally obligated to conform to social norms and value the environmental costs highly. As a result, for dichotomous choice (DC) surveys, respondents may be inclined to choose the maximum amount. For two-way payment ladder (TWPL) surveys, respondents may be inclined to report overly large values, shifting the distribution to the right and leading to large variations in reported values.
There are many other sources of bias for the surveys. For example, the subset of the population that participates in the survey may not be representative of the population. The design of questionnaires may also affect responses. However, for the purpose of comparing the differences between survey types, these biases may not be as significant.
- No solution is provided.
- No solution is provided.
- (a)–(c) No solution is provided.
- Solution figures 11.1, 11.2, and 11.3 provide solutions for all the indices. Values are rounded to two decimal places.
| exaggeration | not.human.activity | no.evidence | |
|---|---|---|---|
| exaggeration | 1.00 | ||
| not.human.activity | 0.39 | 1.00 | |
| no.evidence | 0.42 | 0.46 | 1.00 |
Correlation table for survey items on climate change scepticism: Climate change is exaggerated (exaggeration), Human activity is not the main cause of climate change (not.human.activity), No evidence of global warming (no.evidence).
Solution figure 11.1 Correlation table for survey items on climate change scepticism: Climate change is exaggerated (exaggeration), Human activity is not the main cause of climate change (not.human.activity), No evidence of global warming (no.evidence).
| too.much | not.pass.laws | minimal.intervention | not.dictate | indiv.freedom | personal.responsibility | |
|---|---|---|---|---|---|---|
| too.much | 1.00 | |||||
| not.pass.laws | 0.25 | 1.00 | ||||
| minimal.intervention | 0.32 | 0.12 | 1.00 | |||
| not.dictate | 0.68 | 0.28 | 0.33 | 1.00 | ||
| indiv.freedom | 0.29 | 0.41 | 0.02 | 0.27 | 1.00 | |
| personal.responsibility | 0.41 | 0.08 | 0.31 | 0.46 | 0.10 | 1.00 |
Correlation table for survey items on government intervention: the government interferes too much (too.much), governments should not pass laws so that people can act to their own advantage (not.pass.laws), governments should intervene as little as possible in economic matters (minimal.intervention), governments should stop dictating to people how they should live (not.dictate), the government should not do more to achieve social goals even if it restricts individual freedom (indiv.freedom), individuals should have more personal responsibility (personal.responsibility).
Solution figure 11.2 Correlation table for survey items on government intervention: the government interferes too much (too.much), governments should not pass laws so that people can act to their own advantage (not.pass.laws), governments should intervene as little as possible in economic matters (minimal.intervention), governments should stop dictating to people how they should live (not.dictate), the government should not do more to achieve social goals even if it restricts individual freedom (indiv.freedom), individuals should have more personal responsibility (personal.responsibility).
| buy.local | indiv.impact | feel.better | public.transport | conserve.energy | reduce.emissions | |
|---|---|---|---|---|---|---|
| buy.local | 1.00 | |||||
| indiv.impact | 0.48 | 1.00 | ||||
| feel.better | 0.43 | 0.63 | 1.00 | |||
| public.transport | 0.42 | 0.44 | 0.46 | 1.00 | ||
| conserve.energy | 0.41 | 0.50 | 0.52 | 0.57 | 1.00 | |
| reduce.emissions | 0.46 | 0.65 | 0.59 | 0.39 | 0.46 | 1.00 |
Correlation table for survey items on ‘personal responsibility for the environment’: I buy locally to reduce emissions (buy.local), I am obliged to take impact of daily activities on climate (individual.impact), I feel better when reducing emissions (feel.better), I prefer to use public transport (public.transport), I feel uncomfortable when consuming energy (conserve.energy), I try to reduce emissions as much as possible (reduce.emissions).
Solution figure 11.3 Correlation table for survey items on ‘personal responsibility for the environment’: I buy locally to reduce emissions (buy.local), I am obliged to take impact of daily activities on climate (individual.impact), I feel better when reducing emissions (feel.better), I prefer to use public transport (public.transport), I feel uncomfortable when consuming energy (conserve.energy), I try to reduce emissions as much as possible (reduce.emissions).
The correlations are all positive and most are moderately strong.
- Cronbach’s alpha assesses the internal reliability or consistency of a set of measures. Cronbach’s alpha ranges between 0 and 1 with 1 indicating maximum reliability. The coefficient values in question are high, suggesting that the indicators within each category measure the same underlying concept.
-
Solution figures 11.4 to 11.9 summarize the distribution of the variables. Values are rounded to two decimal places.
These two groups look very similar in terms of demographic characteristics.
| Gender | TWPL (%) | DC (%) |
|---|---|---|
| Female | 51.78 | 52.29 |
| Male | 48.22 | 47.71 |
Gender of participants, by group.
Solution figure 11.4 Gender of participants, by group.
| Age range | TWPL (%) | DC (%) |
|---|---|---|
| 18–24 | 9.49 | 9.64 |
| 25–29 | 8.30 | 8.65 |
| 30–39 | 17.79 | 17.20 |
| 40–49 | 22.33 | 22.56 |
| 50–59 | 24.11 | 23.86 |
| 60–69 | 17.98 | 18.09 |
Age of participants, by group.
Solution figure 11.5 Age of participants, by group.
| Level of Education | TWPL (%) | DC (%) |
|---|---|---|
| 1 (In school) | 1.19 | 1.29 |
| 2 (Without school degree) | 1.98 | 2.09 |
| 3 (Secondary general school) | 34.19 | 32.80 |
| 4 (Intermediate general school) | 26.28 | 26.94 |
| 5 (Polytechnic school) | 6.92 | 6.86 |
| 6 (University preparatory school) | 29.45 | 30.02 |
Highest educational attainment, by group.
Solution figure 11.6 Highest educational attainment, by group.
| Number of children | TWPL (%) | DC (%) |
|---|---|---|
| No children | 64.62 | 65.71 |
| One | 20.36 | 17.59 |
| Two | 11.07 | 12.33 |
| Three | 2.96 | 3.48 |
| Four or more | 0.99 | 0.89 |
Number of children, by group.
Solution figure 11.7 Number of children, by group.
| Membership | TWPL (%) | DC (%) |
|---|---|---|
| No | 92.29 | 91.35 |
| Yes | 7.71 | 8.65 |
Environmental organization membership, by group.
Solution figure 11.8 Environmental organization membership, by group.
| Income range (euros) | TWPL (%) | DC (%) |
|---|---|---|
| Less than 500 | 2.96 | 4.17 |
| 500–1,100 | 13.44 | 14.21 |
| 1,100–1,500 | 14.23 | 13.22 |
| 1,500–2,000 | 15.02 | 14.61 |
| 2,000–2,600 | 11.46 | 14.81 |
| 2,600–3,200 | 10.67 | 10.74 |
| 3,200–4,000 | 11.07 | 8.15 |
| 4,000–5,000 | 5.14 | 4.97 |
| 5,000–6,000 | 2.77 | 1.69 |
| 6,000–7,500 | 0.79 | 0.40 |
| 7,500 or more | 0.40 | 0.50 |
| Do not want to answer | 12.06 | 12.52 |
Household net income per month in euros, by group.
Solution figure 11.9 Household net income per month in euros, by group.
-
Solution figures 11.10, 11.11, and 11.12 provide summary tables for the indices.
The two groups are quite similar in attitudes. Combined with the answer to Question 5, we can be reasonably confident that any differences in survey responses is due to the question format rather than differences in attitudes or demographics.
| Mean | Std | Min | Max | |
|---|---|---|---|---|
| Ref (DC) | 2.37 | 0.85 | 1.00 | 5.00 |
| Ladder (TWPL) | 2.29 | 0.84 | 1.00 | 5.00 |
Summary table for ‘climate change beliefs’ index.
Solution figure 11.10 Summary table for ‘climate change beliefs’ index.
| Mean | Std | Min | Max | |
|---|---|---|---|---|
| Ref (DC) | 3.19 | 0.66 | 1.00 | 5.00 |
| Ladder (TWPL) | 3.15 | 0.70 | 1.00 | 5.00 |
Summary table for ‘preferences for government intervention’ index.
Solution figure 11.11 Summary table for ‘preferences for government intervention’ index.
| Mean | Std | Min | Max | |
|---|---|---|---|---|
| Ref (DC) | 3.01 | 0.82 | 1.00 | 5.00 |
| Ladder (TWPL) | 3.03 | 0.79 | 1.00 | 5.00 |
Summary table for ‘personal responsibility for the environment’ index.
Solution figure 11.12 Summary table for ‘personal responsibility for the environment’ index.
Part 11.2 Comparing willingness to pay across methods and individual characteristics
- Solution figures 11.13 and 11.14 provide column charts for the variables.
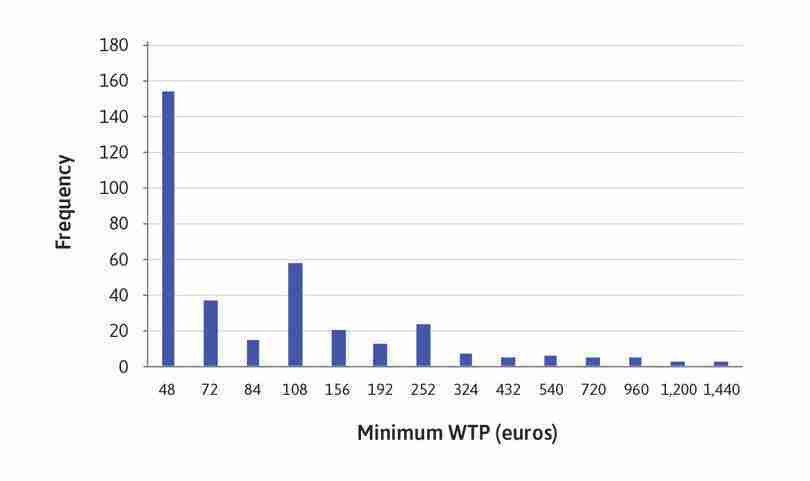
Column charts of minimum WTP.
Solution figure 11.13 Column charts of minimum WTP.
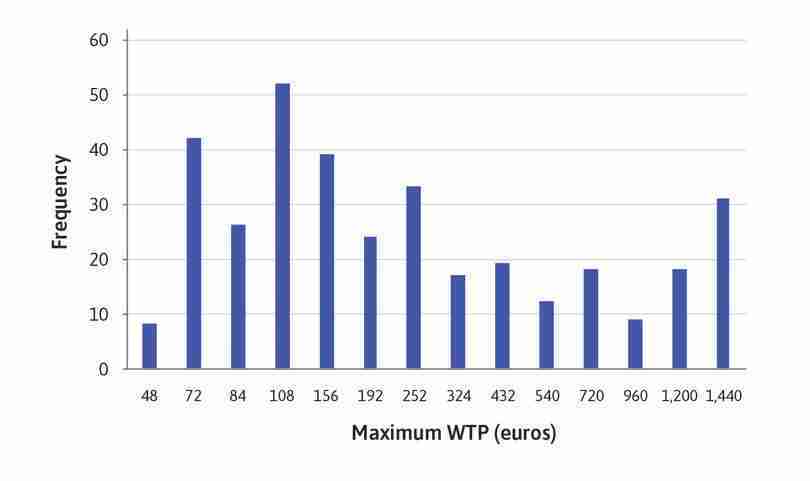
Column charts of maximum WTP.
Solution figure 11.14 Column charts of maximum WTP.
The distributions are more left-heavy (higher number of lower values).
- No solution is provided.
- Mean WTP is 268.53 and median WTP is 132.00 (rounded to two decimal places).
-
Solution figure 11.15 provides the correlation between the average WTP and the demographic and attitudinal variables.
The correlation coefficients are very low, suggesting that average WTP may not be strongly correlated with the variables.
| Variable | Correlation |
|---|---|
| Education | 0.14 |
| Gender | 0.04 |
| Belief | –0.14 |
| Preferences | –0.19 |
| Feelings | 0.19 |
Correlation table of average WTP and other variables.
Solution figure 11.15 Correlation table of average WTP and other variables.
- Solution figure 11.16 shows the table.
| Amount (euros) | No | Yes | Abstain | Total |
|---|---|---|---|---|
| 48 | 21 | 32 | 12 | 65 |
| 72 | 30 | 40 | 11 | 81 |
| 84 | 24 | 45 | 12 | 81 |
| 108 | 35 | 31 | 7 | 73 |
| 156 | 31 | 40 | 13 | 84 |
| 192 | 25 | 25 | 11 | 61 |
| 252 | 32 | 28 | 9 | 69 |
| 324 | 41 | 27 | 16 | 84 |
| 432 | 35 | 29 | 11 | 75 |
| 540 | 31 | 22 | 9 | 62 |
| 720 | 39 | 13 | 12 | 64 |
| 960 | 28 | 15 | 14 | 57 |
| 1,200 | 42 | 21 | 11 | 74 |
| 1,440 | 42 | 15 | 19 | 76 |
| Total | 456 | 383 | 167 | 1,006 |
DC format: Responses for each amount.
Solution figure 11.16 DC format: Responses for each amount.
- Solution figure 11.17 shows the percentage of individuals who voted ‘no’ and ‘yes’ for each amount. Values are rounded to two decimal places.
| Amount (euros) | No | Yes |
|---|---|---|
| 48 | 50.77 | 49.23 |
| 72 | 50.62 | 49.38 |
| 84 | 44.44 | 55.56 |
| 108 | 57.53 | 42.47 |
| 156 | 52.38 | 47.62 |
| 192 | 59.02 | 40.98 |
| 252 | 59.42 | 40.58 |
| 324 | 67.86 | 32.14 |
| 432 | 61.33 | 38.67 |
| 540 | 64.52 | 35.48 |
| 720 | 79.69 | 20.31 |
| 960 | 73.69 | 26.32 |
| 1,200 | 71.62 | 28.38 |
| 1,440 | 80.26 | 19.74 |
DC format: Reponses (in percentages), with ‘abstain’ counted as ‘no’.
Solution figure 11.17 DC format: Reponses (in percentages), with ‘abstain’ counted as ‘no’.
-
Solution figure 11.18 shows the demand curve.
The demand curve is generally downward sloping, with the percentage voting ‘yes’ decreasing as the amount increases, though this relationship is not perfect due to the nature of the survey, with each individual only being asked their willingness to pay for one amount. (This curve therefore does not represent the sum of individuals’ willingness to pay at a given price, so is not a ‘demand curve’ in the strict sense.)
-
Solution figure 11.19 shows the percentage of individuals who voted ‘no’ and ‘yes’ with ‘abstain’ excluded. Solution figure 11.20 provides the demand curve.
The results do not appear to change drastically after excluding ‘abstain’ respondents.
| Amount (euros) | No | Yes |
|---|---|---|
| 48 | 39.62 | 60.38 |
| 72 | 42.86 | 57.14 |
| 84 | 34.78 | 65.22 |
| 108 | 53.03 | 46.97 |
| 156 | 43.66 | 56.34 |
| 192 | 50.00 | 50.00 |
| 252 | 53.33 | 46.67 |
| 324 | 60.29 | 39.71 |
| 432 | 54.69 | 45.31 |
| 540 | 58.49 | 41.51 |
| 720 | 75.00 | 25.00 |
| 960 | 65.12 | 34.88 |
| 1,200 | 66.67 | 33.33 |
| 1,440 | 73.68 | 26.32 |
DC format: Responses (in percentages), with ‘abstain’ responses excluded.
Solution figure 11.19 DC format: Responses (in percentages), with ‘abstain’ responses excluded.
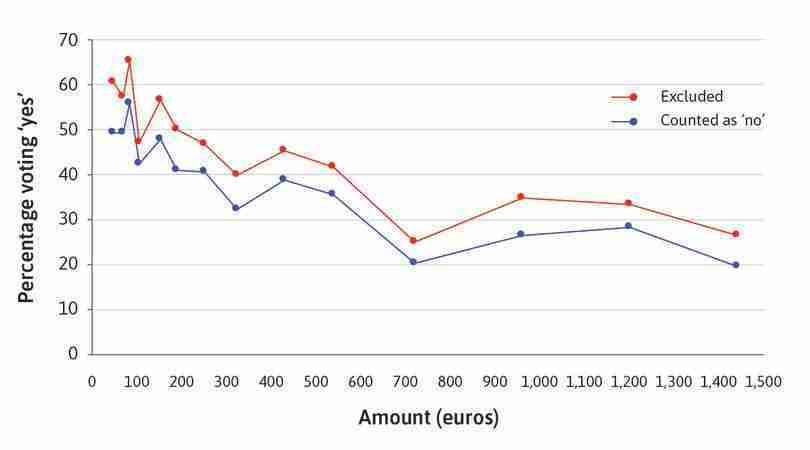
‘Demand curve’ from DC respondents, under different treatments for ‘abstain’ responses.
Solution figure 11.20 ‘Demand curve’ from DC respondents, under different treatments for ‘abstain’ responses.
- In Solution figure 11.21, the extra row shows the calculated values for the difference in means. Values are rounded to two decimal places.
| Format | Mean | Standard deviation | Number of observations |
|---|---|---|---|
| DC | 348.19 | 378.65 | 383 |
| TWPL | 268.54 | 287.70 | 348 |
| Diff in means | 79.65 | 475.50 | 731 |
Summary table for WTP.
Solution figure 11.21 Summary table for WTP.
- The ‘width’ of the confidence interval is 1.55, so the confidence interval is [79.65 – 1.55, 79.65 + 1.55], which is [78.10, 81.21]. The difference in means is large (around 80 euros) and also precisely estimated, so we can be confident that the observed difference is not due to chance i.e. WTP is higher under the DC format than the TWPL format. As the confidence interval lower bound is a long way from 0, the above finding is fairly robust and it is likely that the conclusion would not change even if we allowed for slightly different data models.
- The median for the DC format is 192, which is similar to the median for the TWPL format (132). In contrast, the mean for the DC format is almost double the mean of the TWPL format.
- The median is therefore more robust to changes in question format, and governments may want to use the median instead of mean WTP.
-
The median WTP is slightly lower than what is needed to completely fund the required mitigation activities.
There are many ways to increase support/involvement in climate change mitigation activities. While most people now believe that climate change is real, they may underestimate its severity and/or believe that their individual actions cannot help address the problem. Governments can help change these attitudes through public information campaigns or funding organizations that publicize the effects of climate change (for example, the BBC’s Blue Planet II documentary not only helped raise public awareness of human impact on the environment, but also resulted in lifestyle changes for the majority of people who watched it).
