Empirical Project 3 Measuring the effect of a sugar tax
Learning objectives
In this project you will:
- use the differences-in-differences method to measure the effects of a policy or program, and explain how this method works
- use line and column charts to visualize and compare multiple variables
- create summary tables to describe the data
- interpret the p-value in the context of a policy or program evaluation.
Key concepts
- Concepts needed for this project: mean, frequency table, and p-value.
- Concepts introduced in this project: natural experiment, differences-in-differences, and conditional mean.
Introduction
Core Economics website projects
This empirical project is related to material in:
In Empirical Project 1, we mentioned that natural experiments can help us determine whether one variable causes another variable. A useful application of natural experiments is assessing the effects of a policy. To do so, we compare the outcomes of two groups, both before and after the policy took effect:
- The treatment group: those who were affected by the policy
- The control group: those who were not affected by the policy.
- natural experiment
- An empirical study exploiting naturally occurring statistical controls in which researchers do not have the ability to assign participants to treatment and control groups, as is the case in conventional experiments. Instead, differences in law, policy, weather, or other events can offer the opportunity to analyse populations as if they had been part of an experiment. The validity of such studies depends on the premise that the assignment of subjects to the naturally occurring treatment and control groups can be plausibly argued to be random.
Specifically, we take the difference in outcomes of the treatment and control group before the policy was implemented, and compare it with the difference in outcomes after the policy was implemented. This method is known in economics as differences-in-differences. We need to compare outcomes before the policy has happened, because in a natural experiment we cannot choose exactly who receives the treatment (whereas in the lab we could randomly assign the treatment). Since the two groups are not randomly chosen, we need to account for any pre-existing differences between the two groups that could affect the outcomes, for example differences in age (for people) or characteristics (for products). If these other factors remain constant over the period considered, then we can reasonably conclude that any observed changes in the outcome differences between the groups are due to the policy. Natural experiments therefore allow us to make causal statements about policies and outcomes.
- differences-in-differences
- A method that applies an experimental research design to outcomes observed in a natural experiment. It involves comparing the difference in the average outcomes of two groups, a treatment and control group, both before and after the treatment took place.
We will use the 2014 sugar tax in the US to learn how before-and-after comparisons are done in practice. Sugar-sweetened beverages (SSBs) are considered unhealthy because of their link to conditions such as diabetes and obesity. In November 2014, the city of Berkeley in California became the first US jurisdiction to implement a tax on SSB distributors, with the aim of discouraging SSB consumption. The tax of one cent per fluid ounce meant that if retailers raised their prices to exactly counter the effects of the tax, a $1 can of soda (12 oz) would now cost $1.12. But did sellers actually respond this way? And what effects did the tax have on shoppers’ expenditure on sugary beverages?
A group of researchers did a differences-in-differences study of the effects of this SSB tax, which you can read about in a Forbes article. Figure 3.1 summarizes the timeline of the tax, and the data that they collected and published in a 2017 PLoS Medicine journal paper. We will make before-and-after comparisons using the data they collected, in order to learn about the effects of the sugar tax.
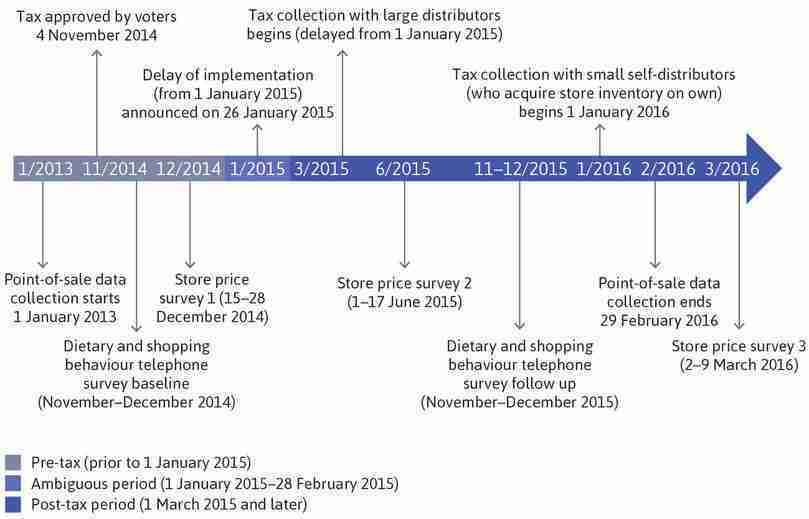
Berkeley sugar-sweetened beverages tax implementation and evaluation timeline.
Figure 3.1 Berkeley sugar-sweetened beverages tax implementation and evaluation timeline.
Lynn D. Silver, Shu Wen Ng, Suzanne Ryan-Ibarra, Lindsey Smith Taillie, Marta Induni, Donna R. Miles, Jennifer M. Poti, and Barry M. Popkin. 2017. Figure 1 in ‘Changes in prices, sales, consumer spending, and beverage consumption one year after a tax on sugar-sweetened beverages in Berkeley, California, US: A before-and-after study’. PLoS Med 14 (4): e1002283.
